empty
22.04.2022 04:50 PM
EUR/USD hot forecast on 22 April

This image is no longer relevant

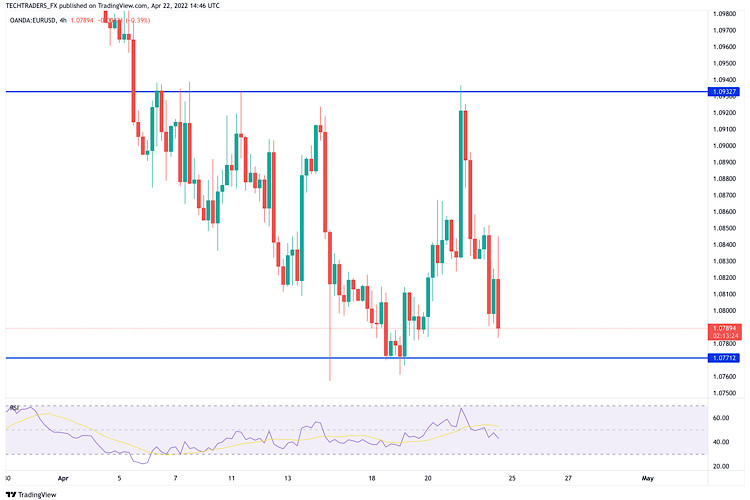
EUR/USD has lost its traction after rising toward 1.0850 in the early American session but continues to trade above 1.0800. The data from the US showed that the business activity in the private sector expanded at a softer pace than expected in early April with the S&P Global Composite PMI declining to 55.1 from 57.7.

With the latest drop witnessed in the early European session, EUR/USD crossed below the 20-period and the 50-period SMAs on the four-hour chart. Additionally, the Relative Strength Index (RSI) indicator retreated below 50, pointing to a bearish shift in the near term.

On the downside, 1.0800 (psychological level) aligns as the first support. In case this level turns into resistance, further losses toward 1.0760 (post-ECB low) and 1.0730 (April 24, 2020, low) could follow.

1.0830 (20-period SMA, 50-period SMA) forms the initial resistance ahead of 1.0850 (Fibonacci 23.6% retracement of the April downtrend) and 1.0880 (100-period SMA).

Jan Novotny,
InstaForex के विश्लेषणात्मक विशेषज्ञ
© 2007-2025
Summary
Urgency
Analytic
Jan Novotny
Start trade
Earn on cryptocurrency rate changes with InstaForex
Download MetaTrader 4 and open your first trade
  • Grand Choice
    Contest by
    InstaForex
    InstaForex always strives to help you
    fulfill your biggest dreams.
    कॉन्टेस्ट में हिस्सा लें

अनुशंसित लेख

हालाँकि सीमित सुधार की संभावना है, XPD/USD आज अपने नज़दीकी रेज़िस्टेंस स्तर तक मजबूत होने की संभावना रखता है। गुरुवार, 25 सितम्बर 2025।

[XPD/USD] – [गुरुवार, 25 सितम्बर 2025] हालाँकि RSI न्यूट्रल–बेयरिश ज़ोन में है, लेकिन EMA(50) और EMA(200) की स्थिति अभी भी गोल्डन क्रॉस कॉन्फ़िगरेशन में है, जो XPD/USD के लिए मजबूती

Arief Makmur 12:11 2025-09-25 UTC+2

नैस्डैक 100 इंडेक्स में आज कमजोरी आने की संभावना है, जो अपने नज़दीकी सपोर्ट स्तर तक जा सकता है। गुरुवार, 25 सितम्बर 2025।

[नैस्डैक 100 इंडेक्स] – [गुरुवार, 25 सितम्बर 2025] हालाँकि दोनों EMA अभी तक डेथ क्रॉस नहीं बना पाए हैं, लेकिन RSI न्यूट्रल–बेयरिश ज़ोन में है, जो आज नैस्डैक 100 इंडेक्स

Arief Makmur 12:06 2025-09-25 UTC+2

बिटकॉइन के लिए ट्रेडिंग सिग्नल (25-28 सितम्बर 2025): $112,500 (4/8 मरे - 38 SMA) के ऊपर खरीदारी करें

बिटकॉइन इस समय लगभग 112,500 के आसपास ट्रेड कर रहा है, जो एक महत्वपूर्ण सपोर्ट क्षेत्र है। हमें लगता है कि यदि कीमत इस क्षेत्र के ऊपर मज़बूती से टिकती

Dimitrios Zappas 11:59 2025-09-25 UTC+2

EUR/USD के लिए 24-26 सितंबर, 2025 के ट्रेडिंग सिग्नल: 1.1840 (+1/8 Murray - 38 SMA) के नीचे बिकें।

इसके विपरीत, यदि यूरो की कीमत 1.1840 के ऊपर टूटती है और समेकन करती है, तो हम उम्मीद कर सकते हैं कि यह अपट्रेंड चैनल की ऊपरी सीमा के आसपास

Dimitrios Zappas 09:33 2025-09-24 UTC+2

सितंबर 24-26, 2025 के लिए बिटकॉइन के ट्रेडिंग सिग्नल: $111,100 (4/8 मरे - 38 SMA) से ऊपर खरीदें।

इसके विपरीत, यदि बिटकॉइन की कीमत $112,500 के आसपास 4/8 मरे स्तर के ऊपर सघनित होती है, तो हम उम्मीद कर सकते हैं कि बिटकॉइन डाउनट्रेंड चैनल के शीर्ष के

Dimitrios Zappas 09:10 2025-09-24 UTC+2

सितंबर 24-26, 2025 के लिए सोने के ट्रेडिंग सिग्नल: $3,791 (8/8 मरे - 38 SMA) से नीचे बेचें।

ईगल इंडिकेटर नकारात्मक सिग्नल दे रहा है, इसलिए किसी भी तकनीकी पुनरुद्धार के साथ और जब तक सोने की कीमत $3,800 के नीचे सघनित रहती है, इसे बेचने का सिग्नल

Dimitrios Zappas 09:07 2025-09-24 UTC+2

EUR/USD का पूर्वानुमान – 23 सितंबर, 2025

EUR/USD दैनिक Kijun-sen (MACD) लाइन पर यूरो में दिखी कमजोरी ने जल्दी ही 18 सितंबर की रेंज में तेज़ी से वापसी का कारण बन गई, क्योंकि अमेरिकी सरकारी बांड

Laurie Bailey 06:46 2025-09-23 UTC+2

GBP/USD का पूर्वानुमान – 23 सितंबर, 2025

GBP/USD कल अमेरिकी डॉलर इंडेक्स में 0.39% की गिरावट ने ब्रिटिश पाउंड की डाउनवर्ड मूवमेंट को जारी रखने में बाधा डाली। कीमत Kijun-sen (MACD) लाइन पर लौट

Laurie Bailey 06:44 2025-09-23 UTC+2

USD/CAD का पूर्वानुमान – 23 सितंबर, 2025

USD/CAD कल USD/CAD जोड़ी के लिए एक महत्वपूर्ण दिन था — कीमत ने बैलेंस इंडिकेटर लाइन के रेसिस्टेंस और 1.3810 के लक्ष्य स्तर को पार किया, साथ ही मार्लिन ऑस्सीलेटर

Laurie Bailey 06:42 2025-09-23 UTC+2

GBP/USD. 22-27 सितंबर के सप्ताह के लिए तकनीकी विश्लेषण

पिछले हफ़्ते, यह जोड़ी 1.3721 (काली धराशायी रेखा) पर बोलिंगर बैंड रेखा की ओर ऊपर की ओर बढ़ी, और फिर कीमत नीचे की ओर मुड़ गई, जिससे साप्ताहिक कैंडल 1.3466

Stefan Doll 20:29 2025-09-22 UTC+2
अभी बात नहीं कर सकते?
अपना प्रश्न पूछें बातचीत.
Widget callback
 

Dear visitor,

Your IP address shows that you are currently located in the USA. If you are a resident of the United States, you are prohibited from using the services of InstaFintech Group including online trading, online transfers, deposit/withdrawal of funds, etc.

If you think you are seeing this message by mistake and your location is not the US, kindly proceed to the website. Otherwise, you must leave the website in order to comply with government restrictions.

Why does your IP address show your location as the USA?

  • - you are using a VPN provided by a hosting company based in the United States;
  • - your IP does not have proper WHOIS records;
  • - an error occurred in the WHOIS geolocation database.

Please confirm whether you are a US resident or not by clicking the relevant button below. If you choose the wrong option, being a US resident, you will not be able to open an account with InstaForex anyway.

We are sorry for any inconvenience caused by this message.