empty
09.04.2025 10:07 AM
EUR/USD and GBP/USD – Technical Analysis for April 9

EUR/USD

This image is no longer relevant

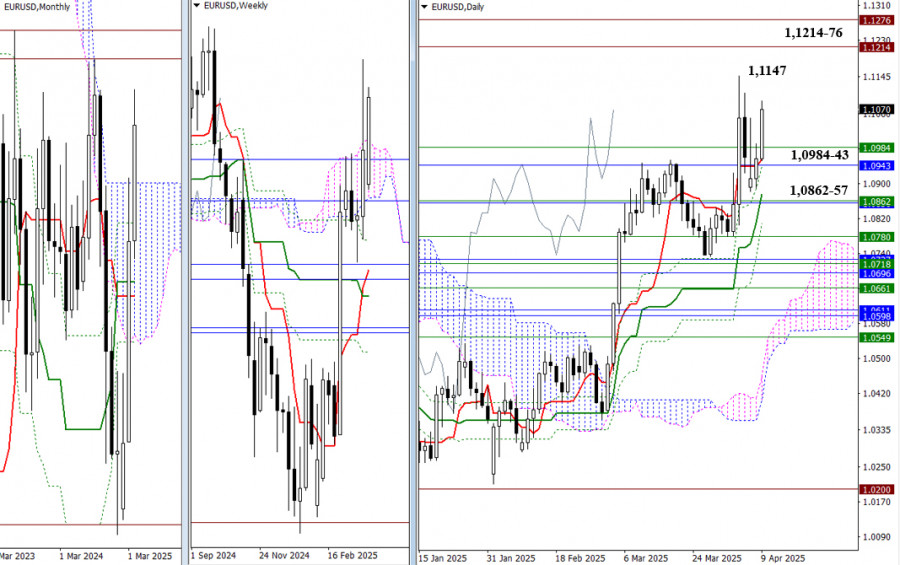
The bulls are attempting to regain control, and we are currently observing increased activity and a push toward the peak of the ongoing correction at 1.1147. A breakout above this level would shift the market's focus to historical resistance at 1.1214 and 1.1276. However, if buyers fail to achieve a breakout, the pair may again fall into the gravitational pull of support levels from various timeframes located lower at 1.0984 – 1.0943 – 1.0862-57.

This image is no longer relevant

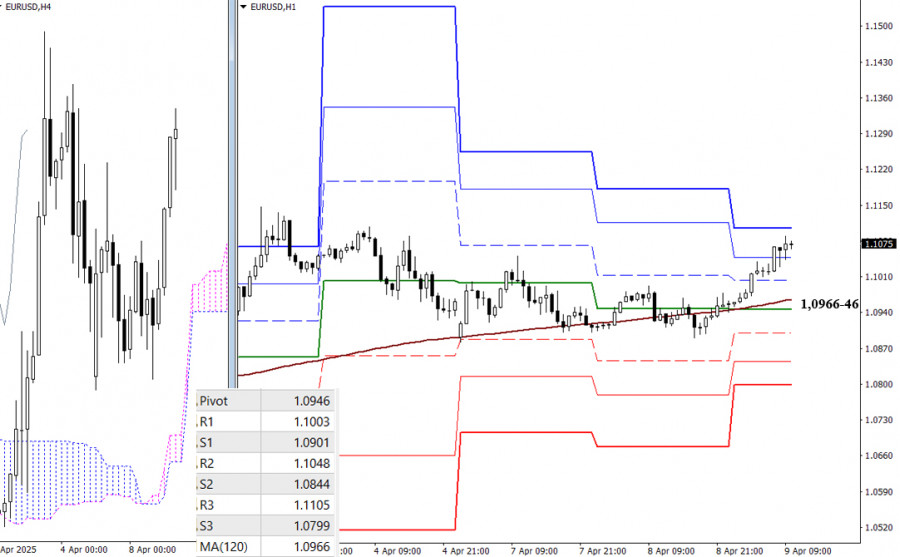
The weekly long-term trend has kept the market in bullish territory, enabling the bulls to initiate another upward move. Among key targets, the final resistance of the classic Pivot levels at 1.1105 remains untested, followed by higher timeframe boundaries. In the event of a downward correction, key support levels to watch are 1.0964-46 (central Pivot level + weekly long-term trend). If bearish pressure intensifies, further support will be found at 1.0901 – 1.0844 – 1.0799 (classic Pivot levels).

***

GBP/USD

This image is no longer relevant

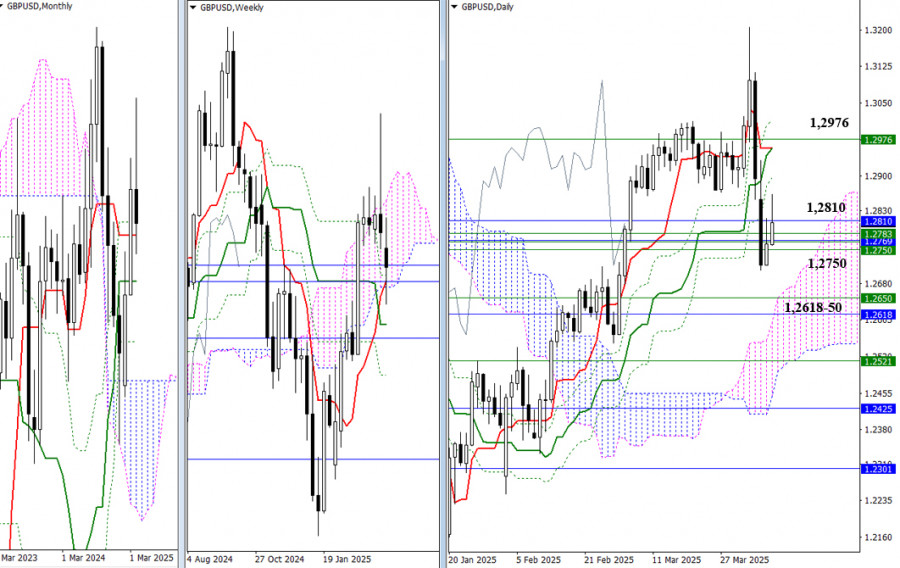
Recently, the British pound has been trying to halt its decline. Bulls are supported by a broad support zone between 1.2750 – 1.2810, which combines levels from different timeframes. If buyers consolidate above this zone, the market's attention will shift to the Ichimoku daily cross resistances at 1.1298 – 1.2956 – 1.3015, further reinforced by the weekly level at 1.2976. Failure to break higher could give sellers a good opportunity to regain control. The next downward target is located near the monthly medium-term trends at 1.2618 and the weekly trend at 1.2650, as well as the upper boundary of the daily cloud.

This image is no longer relevant

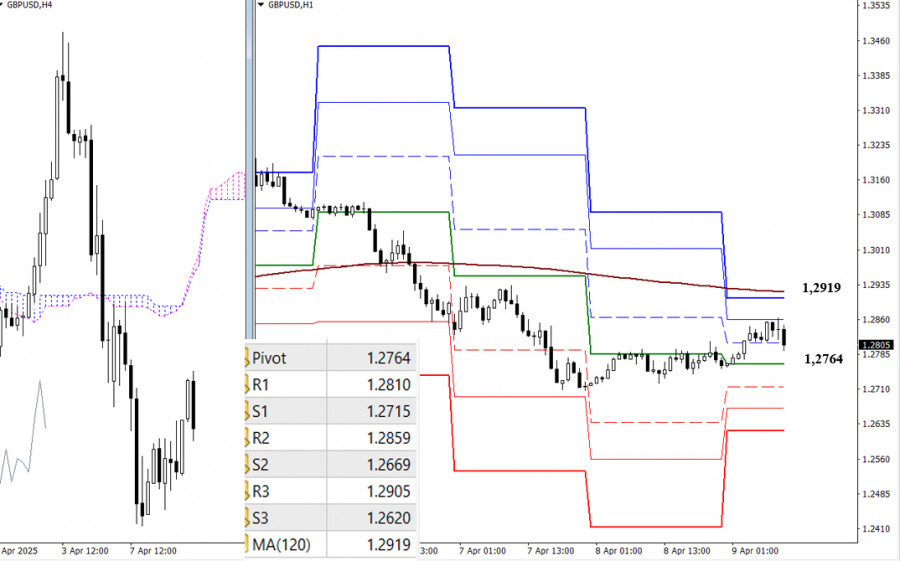
The bears still hold the advantage on lower timeframes, although a corrective upward move is underway. Its main target is the weekly long-term trend resistance at 1.2919. A breakout above and reversal of this trend would shift the balance in favor of the bulls. If the bears stop the correction and resume the decline, the next support levels will be the classic Pivot levels at 1.2764 – 1.2715 – 1.2669 – 1.2620.

***

Technical Analysis Components:
  • Higher Timeframes: Ichimoku Kinko Hyo (9.26.52) and Fibonacci Kijun levels
  • H1: Classic Pivot Points and 120-period Moving Average (weekly long-term trend)
Evangelos Poulakis,
Analytical expert of InstaForex
© 2007-2025
Summary
Urgency
Analytic
Zhizhko Nadezhda
Start trade
Earn on cryptocurrency rate changes with InstaForex
Download MetaTrader 4 and open your first trade
  • Chancy Deposit
    Deposit your account with $3,000 and get $3000 more!
    In September we raffle $3000 within the Chancy Deposit campaign!
    Get a chance to win by depositing $3,000 to a trading account. Having fulfilled this condition, you become a campaign participant.
    JOIN CONTEST

Recommended Stories

XAU/USD. Analysis and Forecast

Despite positive U.S. data and pressure on the precious metal from the dollar, gold continues to attract buyers. From a technical perspective, however, Tuesday's failure near the round level

Irina Yanina 22:01 2025-09-25 UTC+2

Forex forecast 25/09/2025: EUR/USD, GBP/USD, USD/JPY, USD/CHF, SP500 and Bitcoin

Useful links: My other articles are available in this section InstaForex course for beginners Popular Analytics Open trading account Important: The begginers in forex trading need to be very careful

Sebastian Seliga 11:32 2025-09-25 UTC+2

Forecast for EUR/USD on September 25, 2025

On Wednesday, the EUR/USD pair formed a new reversal in favor of the U.S. dollar and consolidated below the 1.1789–1.1802 zone. Thus, the decline may continue today toward the 76.4%

Samir Klishi 10:25 2025-09-25 UTC+2

Forecast for GBP/USD on September 25, 2025

On the hourly chart, the GBP/USD pair on Wednesday formed a new reversal in favor of the U.S. dollar and consolidated below the 76.4% Fibonacci level at 1.3482, working through

Samir Klishi 10:24 2025-09-25 UTC+2

GBP/USD. Indicator analysis on September 25, 2025

On Wednesday, the pair moved downward, testing the 76.4% retracement level at 1.3424 (red dotted line), and then the price turned upward, closing the daily candle at 1.3442. Today

Stefan Doll 10:13 2025-09-25 UTC+2

EUR/USD. Indicator analysis on September 25, 2025

On Wednesday, the pair moved downward, testing the 61.8% retracement level at 1.1734 (red dotted line) and closing the daily candle at 1.1737. Today, the price may continue to move

Stefan Doll 10:08 2025-09-25 UTC+2

Although there is potential for a limited correction, XPD/USD is likely to strengthen today up to its nearest resistance level. Thursday, September 25, 2025.

[XPD/USD] – [Thursday, September 25, 2025] Although the RSI is in the Neutral-Bearish zone, but the position of EMA(50) & EMA(200) still in a Golden Cross configuration confirms the strengthening

Arief Makmur 08:19 2025-09-25 UTC+2

Nasdaq 100 Index has the potential to weaken today, up to its nearest support level. Thursday, September 25, 2025.

[Nasdaq 100 Index] – [Thursday, September 25, 2025] Although both EMAs have not yet formed a Death Cross, but the RSI is in the Neutral-Bearish zone, which may bring

Arief Makmur 08:19 2025-09-25 UTC+2

Trading Signals for EUR/USD for September 25-28, 2025: buy above 1.1710 (8/8 Murray - 38 SMA)

The euro is trading around 1.1744 under bearish pressure after an unsuccessful attempt to break out of the downtrend channel. EUR/USD is now trading below the 38- and 200-period moving

Dimitrios Zappas 06:42 2025-09-25 UTC+2

Trading Signals for BITCOIN for September 25-28, 2025: buy above $112,500 (4/8 Murray - 38 SMA)

Bitcoin is trading around 112,500, an important support area where we believe it could resume its bullish cycle in the coming hours, only if the price consolidates above this area

Dimitrios Zappas 06:40 2025-09-25 UTC+2
Can't speak right now?
Ask your question in the chat.
Widget callback
 

Dear visitor,

Your IP address shows that you are currently located in the USA. If you are a resident of the United States, you are prohibited from using the services of InstaFintech Group including online trading, online transfers, deposit/withdrawal of funds, etc.

If you think you are seeing this message by mistake and your location is not the US, kindly proceed to the website. Otherwise, you must leave the website in order to comply with government restrictions.

Why does your IP address show your location as the USA?

  • - you are using a VPN provided by a hosting company based in the United States;
  • - your IP does not have proper WHOIS records;
  • - an error occurred in the WHOIS geolocation database.

Please confirm whether you are a US resident or not by clicking the relevant button below. If you choose the wrong option, being a US resident, you will not be able to open an account with InstaForex anyway.

We are sorry for any inconvenience caused by this message.