empty
14.01.2025 03:14 AM
Trading Recommendations and Analysis for GBP/USD on January 14: Will the Pound Ever Rise?

GBP/USD 5-Minute Analysis

This image is no longer relevant

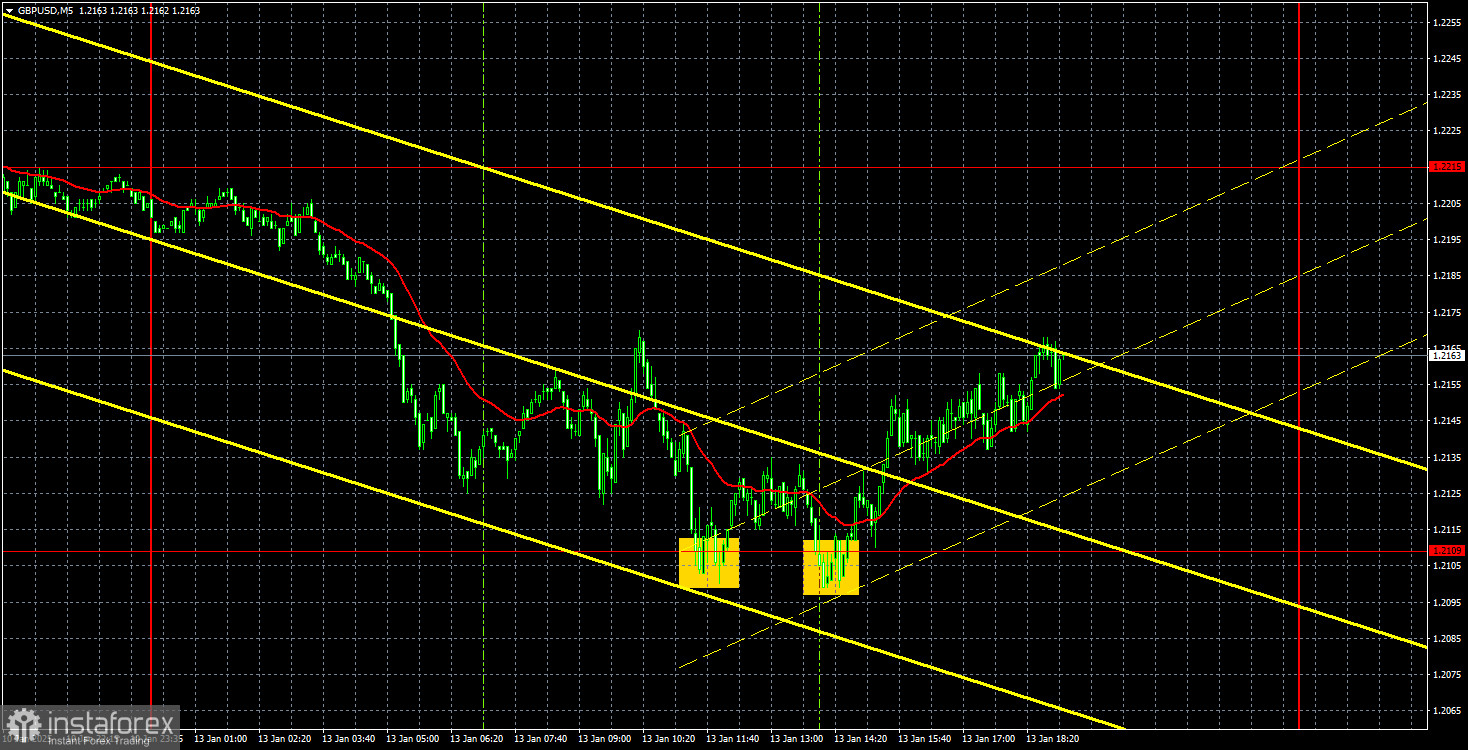
The GBP/USD pair continued its downward movement on Monday. Despite the absence of any reports from the UK or the U.S., the pound sterling depreciated by 110 pips during the first half of the day. The 1.2100 level was able to temporarily halt the decline, but the question remains: for how long?

The market's willingness to sell off the pound, even on days without local catalysts, indicates a distinctly bearish sentiment. This sentiment has persisted for three months, driven by well-known factors we have extensively discussed. While we may see a new correction beginning—potentially a strong one, as the daily timeframe suggests a need for a noticeable correction—it will not alter the overall trend. The pound remains firmly entrenched in a 16-year downtrend.

This week, the pound faces two significant tests: U.S. inflation and UK inflation. If U.S. inflation exceeds expectations and/or UK inflation slows or falls short of forecasts, the pound may quickly resume its steep decline. Conversely, positive data could support an upward correction.

On the 5-minute timeframe, two decent buy signals were generated on Monday. However, it raises the question: is it wise to buy during such a pronounced decline? These signals effectively mirrored each other and could have been traded, but we would not recommend taking such risks. It's better to miss a correction than to go against the trend, which could result in significant losses or lead to reliance on perpetual averaging. The pound could still plunge significantly lower.

COT Report

This image is no longer relevant

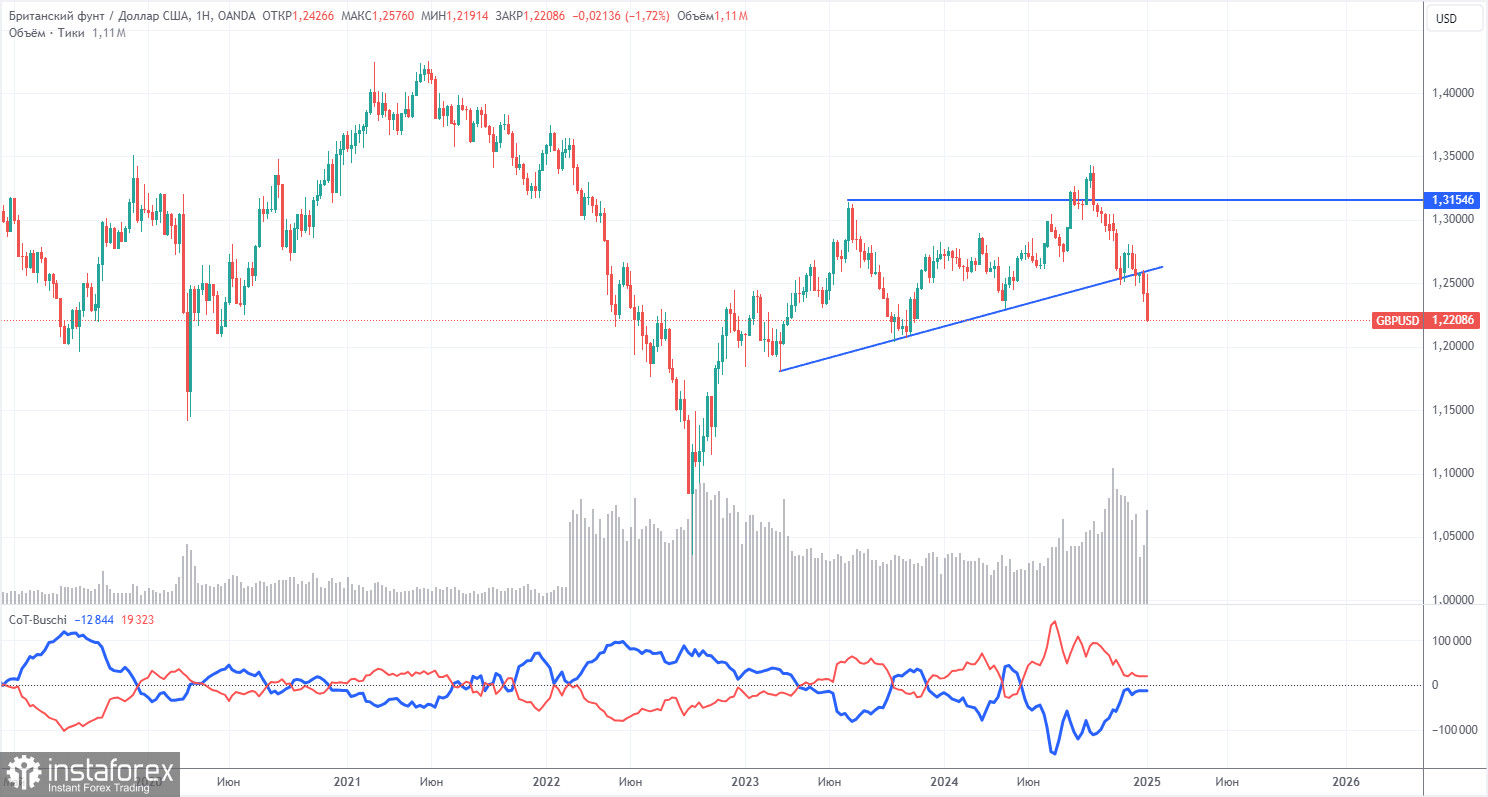
The latest Commitment of Traders (COT) report for the pound sterling highlights the fluctuating sentiment among commercial traders in recent years. The red and blue lines, representing the net positions of commercial and non-commercial traders, often cross each other and typically hover around the zero mark. Currently, these lines are close together, indicating a roughly equal number of long and short positions.

On the weekly timeframe, the price initially broke below the 1.3154 level and subsequently dropped further, breaching the trendline. This break suggests that the pound's decline is likely to continue in the long term.

According to the latest COT data, the non-commercial group opened 1,600 buy contracts and 100 sell contracts, resulting in a net position increase of 1,500 contracts. However, this does not indicate a positive outlook for the pound.

The fundamental backdrop does not provide any justification for long-term purchases of the pound. Instead, the currency appears to be on the verge of a renewed global downtrend. As a result, the net position may continue to decline, signaling further waning demand for the pound.

GBP/USD 1-Hour Analysis

This image is no longer relevant

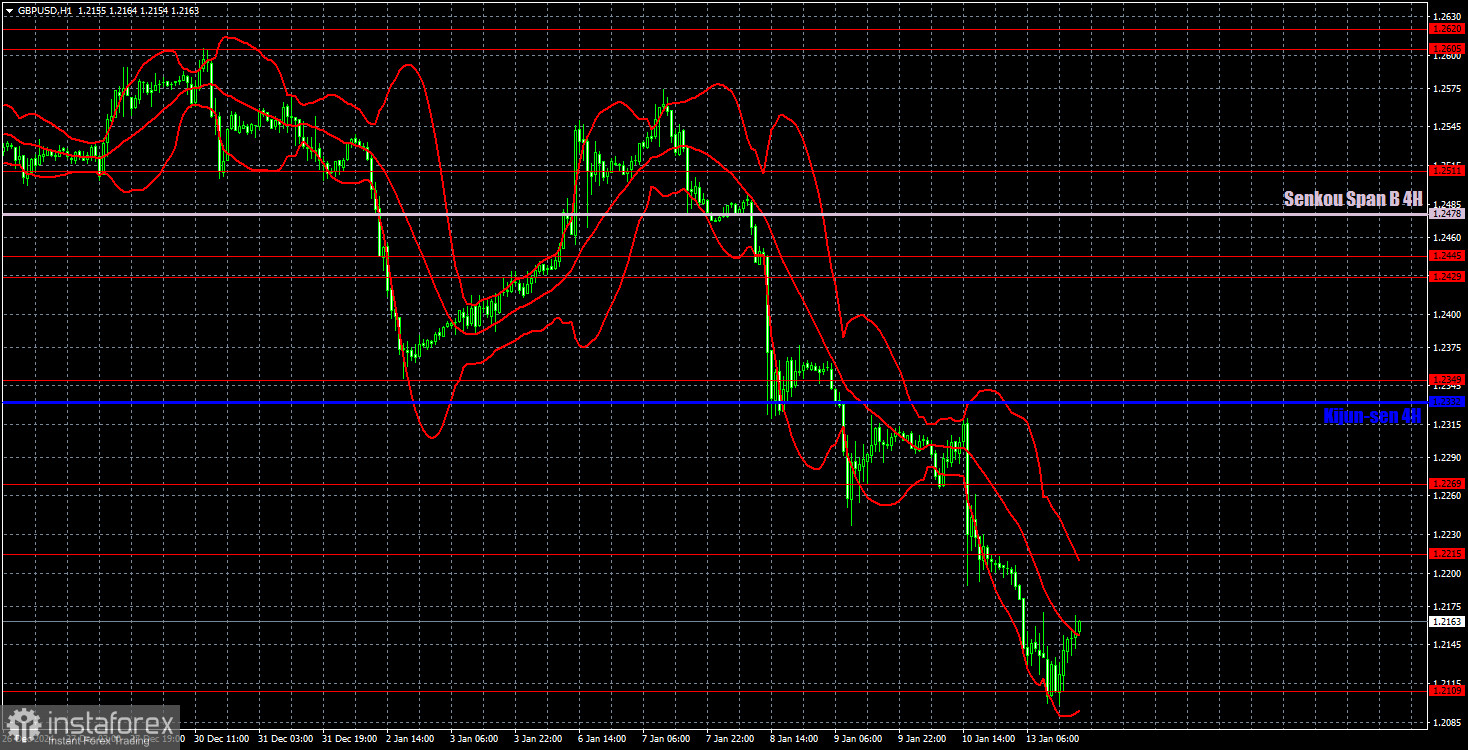
On the hourly timeframe, the GBP/USD pair maintains a bearish outlook, with the most recent corrective move ending swiftly. There remains little reason for the pound to rise, except for the technical necessity of occasional corrections, a pattern that has been consistent week after week. In the medium term, we still anticipate further declines for the pound.

On January 14, we identify the following important levels: 1.2052, 1.2109, 1.2215, 1.2269, 1.2349, 1.2429-1.2445, 1.2511, 1.2605-1.2620, 1.2691-1.2701, 1.2796-1.2816, and 1.2863. The Senkou Span B (1.2478) and Kijun-sen (1.2332) lines may also provide trading signals. It is advisable to set the Stop Loss level at breakeven once the price moves 20 pips in the desired direction. Keep in mind that the Ichimoku indicator lines can fluctuate throughout the day, which should be considered when determining trading signals.

No major events are scheduled in the UK or the U.S. for Tuesday, aside from the Producer Price Index (PPI) in the U.S. However, we do not expect this report to attract significant interest from traders, especially with upcoming inflation reports from both the UK and the U.S. set to take precedence later this week.

Illustration Explanations:

  • Support and Resistance Levels (thick red lines): Thick red lines indicate where movement may come to an end. Please note that these lines are not sources of trading signals.
  • Kijun-sen and Senkou Span B Lines: Ichimoku indicator lines transferred from the 4-hour timeframe to the hourly timeframe. These are strong lines.
  • Extreme Levels (thin red lines): Thin red lines where the price has previously bounced. These serve as sources of trading signals.
  • Yellow Lines: Trendlines, trend channels, or any other technical patterns.
  • Indicator 1 on COT Charts: Represents the net position size for each category of traders.
Paolo Greco,
Analytical expert of InstaForex
© 2007-2025
Summary
Urgency
Analytic
Stanislav Polyanskiy
Start trade
Earn on cryptocurrency rate changes with InstaForex
Download MetaTrader 4 and open your first trade
  • Grand Choice
    Contest by
    InstaForex
    InstaForex always strives to help you
    fulfill your biggest dreams.
    JOIN CONTEST

Recommended Stories

How to Trade the GBP/USD Currency Pair on November 4? Simple Tips and Trade Analysis for Beginners

On Monday, the GBP/USD pair made yet another attempt to break through the level of 1.3107, resulting in a third bounce. However, traders are not giving up and will attempt

Paolo Greco 07:06 2025-11-04 UTC+2

How to Trade the EUR/USD Currency Pair on November 4? Simple Tips and Trade Analysis for Beginners

On Monday, the EUR/USD currency pair continued its downward movement with minimal volatility. The low volatility observed in recent weeks did not raise any concerns, as important macroeconomic reports have

Paolo Greco 07:06 2025-11-04 UTC+2

Trading Recommendations and Trade Analysis for GBP/USD on November 4. The Pound Continues to Crawl

The GBP/USD currency pair on Monday attempted for the third time to break through the updated support level at 1.3115. There were again no grounds for the decline

Paolo Greco 02:04 2025-11-04 UTC+2

Trading Recommendations and Trade Analysis for EUR/USD on November 4. ISM Index Did Not Help

The EUR/USD currency pair traded with less than 40 pips of volatility on Monday. This article could almost end here, as it is clear that no macroeconomic report

Paolo Greco 02:04 2025-11-04 UTC+2

How to Trade the GBP/USD Currency Pair on November 3? Simple Tips and Trade Analysis for Beginners

The GBP/USD pair continued its downward movement on Friday but bounced back by the end of the day. As a reminder, the British pound has been falling for an entire

Paolo Greco 06:29 2025-11-03 UTC+2

How to Trade the EUR/USD Currency Pair on November 3? Simple Tips and Trade Analysis for Beginners

The EUR/USD currency pair continued its downward movement on Friday for somewhat dubious reasons. On the last trading day of the week, the only event that might have interested novice

Paolo Greco 06:29 2025-11-03 UTC+2

Trading Recommendations and Analysis of GBP/USD for November 3. Is the Pound Preparing for the Bank of England Meeting?

The GBP/USD currency pair avoided a new decline on Friday, though in the first half of the day, it was poised to extend its decline. There were no significant news

Paolo Greco 03:32 2025-11-03 UTC+2

Trading Recommendations and Analysis of EUR/USD for November 3. Inflation in the EU – a New Reason to Sell

The EUR/USD currency pair continued its downward movement on Friday after breaking through another ascending trendline. As mentioned, there is an ongoing flat trend on the daily timeframe

Paolo Greco 03:32 2025-11-03 UTC+2

How to Trade the GBP/USD Currency Pair on October 31? Simple Tips and Trade Analysis for Beginners

On Thursday, the GBP/USD pair continued its downward movement despite no noteworthy events in either the UK or the US. However, the FOMC results were announced the day before

Paolo Greco 06:42 2025-10-31 UTC+2

How to Trade the EUR/USD Currency Pair on October 31? Simple Tips and Trade Analysis for Beginners

The EUR/USD pair continued its decline on Thursday after breaching yet another ascending trend line the day before. The European currency is falling again; the flat on the daily timeframe

Paolo Greco 06:42 2025-10-31 UTC+2
Can't speak right now?
Ask your question in the chat.
Widget callback
 

Dear visitor,

Your IP address shows that you are currently located in the USA. If you are a resident of the United States, you are prohibited from using the services of InstaFintech Group including online trading, online transfers, deposit/withdrawal of funds, etc.

If you think you are seeing this message by mistake and your location is not the US, kindly proceed to the website. Otherwise, you must leave the website in order to comply with government restrictions.

Why does your IP address show your location as the USA?

  • - you are using a VPN provided by a hosting company based in the United States;
  • - your IP does not have proper WHOIS records;
  • - an error occurred in the WHOIS geolocation database.

Please confirm whether you are a US resident or not by clicking the relevant button below. If you choose the wrong option, being a US resident, you will not be able to open an account with InstaForex anyway.

We are sorry for any inconvenience caused by this message.