empty
26.02.2024 06:20 AM
GBP/USD Day | Bullish Rise

This image is no longer relevant

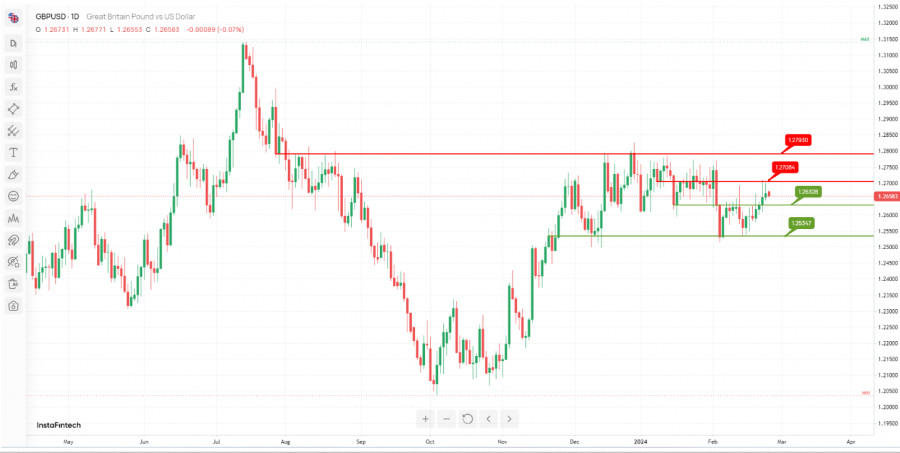
The GBP/USD, the potential bullish bounce scenario is as follows:

Description: The chart indicates a potential bullish bounce, with significant support identified at two levels.

Support Levels:

The 1st support level is at 1.2632, characterized by "An Overlap support." This level suggests a historical area where the price has found support, coinciding with previous price action.

The 2nd support level is positioned at 1.2534, noted as "An Overlap support." This level represents another historical zone where price has found support, indicating potential buying interest.

Resistance Levels:

The 1st resistance level is observed at 1.2708, designated as "An Overlap resistance." This level indicates a historical barrier where the price has encountered selling pressure after reaching previous highs.

The 2nd resistance level is located at 1.2793, recognized as "An Overlap resistance." Like the 1st resistance, it represents another historical level where the price has struggled to move above due to selling pressure.

Dean Leo,
Analytical expert of InstaForex
© 2007-2025
Summary
Urgency
Analytic
Dean Leo
Start trade
Earn on cryptocurrency rate changes with InstaForex
Download MetaTrader 4 and open your first trade
  • Grand Choice
    Contest by
    InstaForex
    InstaForex always strives to help you
    fulfill your biggest dreams.
    JOIN CONTEST

Recommended Stories

EUR/USD. Technical Analysis for September 2025

In August, the pair, moving upward, tested the historical resistance level of 1.1710 (blue dotted line) and then pulled back slightly, closing the monthly candle at 1.1685. In September

Stefan Doll 09:53 2025-09-01 UTC+2

GBP/USD. Technical Analysis for the Week of September 1–6

Last week, the pair moved downward, tested the 21-period simple moving average at 1.3428 (black dotted line), and then turned upward, closing the weekly candle at 1.3502. In the upcoming

Stefan Doll 09:50 2025-09-01 UTC+2

EUR/USD. Technical Analysis for the Week of September 1–6

Last week, the pair moved downward, tested the upper fractal at 1.1571 (red dotted line), and then turned upward, closing the weekly candle at 1.1685. In the upcoming week

Stefan Doll 09:46 2025-09-01 UTC+2

GBP/USD. Indicator Analysis on September 1, 2025

On Friday, the pair moved downward, tested the 21-period simple moving average at 1.3449 (black dotted line), and then turned upward, closing the daily candle at 1.3502. Today, the price

Stefan Doll 09:42 2025-09-01 UTC+2

EUR/USD. Indicator Analysis on September 1, 2025

On Friday, the pair, moving downward, tested the retracement level of 23.6% – 1.1659 (blue dotted line) and then turned upward, closing the daily candle at 1.1685. Today, the price

Stefan Doll 09:38 2025-09-01 UTC+2

EUR/USD Forecast for September 1, 2025

EUR/USD On Friday, the euro managed to consolidate above the MACD indicator line. The Marlin oscillator is rising in positive territory. The nearest resistance at 1.1750, marked by the MACD

Laurie Bailey 04:55 2025-09-01 UTC+2

GBP/USD Forecast for September 1, 2025

GBP/USD The British pound has been struggling to break the 1.3525 resistance for the third consecutive day. The probability of a successful breakout exceeds 50%, as the price has settled

Laurie Bailey 04:55 2025-09-01 UTC+2

Oil Forecast for September 1, 2025

Oil (CL) Oil failed to retest the MACD line on the daily chart after its first attempt on August 25, and now that moment marks a reversal with downside prospects

Laurie Bailey 04:55 2025-09-01 UTC+2

Forecast for EUR/USD on August 29, 2025

On Thursday, the EUR/USD pair rebounded from the 1.1637–1.1645 zone and continued its upward move, as I expected. The rebound from the 76.4% retracement level – 1.1695 worked in favor

Samir Klishi 12:42 2025-08-29 UTC+2

Forecast for GBP/USD on August 29, 2025

On the hourly chart, the GBP/USD pair on Thursday rebounded from the 76.4% retracement level – 1.3482, which allows it to continue rising toward the 100.0% Fibonacci level – 1.3586

Samir Klishi 12:32 2025-08-29 UTC+2
Can't speak right now?
Ask your question in the chat.
Widget callback
 

Dear visitor,

Your IP address shows that you are currently located in the USA. If you are a resident of the United States, you are prohibited from using the services of InstaFintech Group including online trading, online transfers, deposit/withdrawal of funds, etc.

If you think you are seeing this message by mistake and your location is not the US, kindly proceed to the website. Otherwise, you must leave the website in order to comply with government restrictions.

Why does your IP address show your location as the USA?

  • - you are using a VPN provided by a hosting company based in the United States;
  • - your IP does not have proper WHOIS records;
  • - an error occurred in the WHOIS geolocation database.

Please confirm whether you are a US resident or not by clicking the relevant button below. If you choose the wrong option, being a US resident, you will not be able to open an account with InstaForex anyway.

We are sorry for any inconvenience caused by this message.