empty
13.11.2023 08:11 PM
Technical analysis on GBP/USD on November 13, 2023

This image is no longer relevant

Overview :

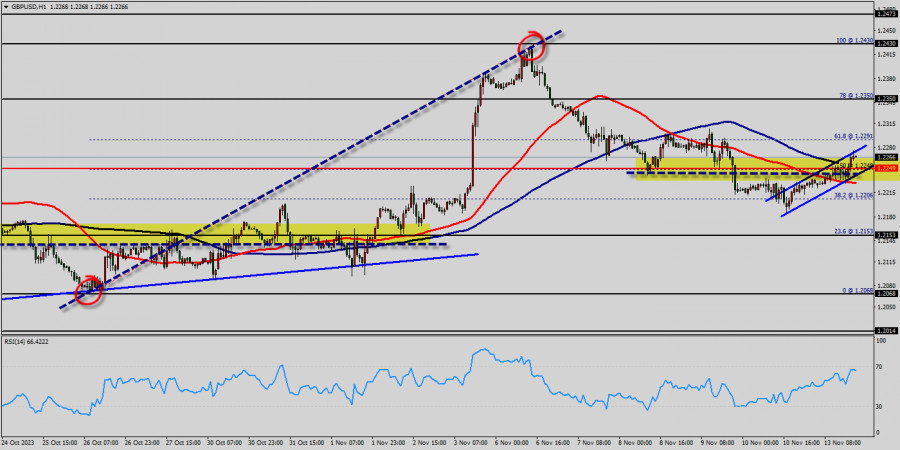
The GBP/USD pair traded in different directions in the range of 1.2206 - 1.2350 and closed the day without significant changes. Today the pair also traded in a narrow range of 1.2240-1.2200, remaining close to Friday's closing price.

On the hourly chart, the GBP/USD pair is still testing the strength of the support - the moving average line MA (100) H1 (1.2249). The situation is similar on the four-hour chart. Based on the above, it is probably worth sticking to the north direction in trading and while the pair remains above MA 100 H1, may be you need to look for entry points to buy at the end of the correction.

From a technical point of view, the GBP/USD pair holds on the winning side, according to the daily chart. The pair develops well above a bullish 50 Simple Moving Average (SMA), currently providing dynamic support at around 1.2153.

The 50 and 100 SMAs offer modest downward slopes, converging around the 1.2249 price zone. Finally, the Momentum indicator aims north, firmly bouncing from its midline, while the Relative Strength Index (RSI) indicator consolidates around 66.

The GBP/USD pair has faced strong support at the level of 1.2153 because resistance became support. So, the strong support has been already faced at the level of 1.2153 and the pair is likely to try to approach it in order to test it again.

The level of 1.2249 represents a weekly pivot point for that it is acting as minor support this week. Furthermore, the GBP/USD pair is continuing to trade in a bullish trend from the new support level of 1.2153.

Currently, the price is in a bullish channel. According to the previous events, we expect the GBP/USD pair to move between 1.2153 and 1.2350. Also, it should be noticed that the double top is set at 1.2430. Additionally, the RSI is still signaling that the trend is upward as it remains strong above the moving average (100).

This suggests the pair will probably go up in coming hours. Accordingly, the market is likely to show signs of a bullish trend. In other words, buy orders are recommended above 1.2249 with the first target at the level of 1.2350. If the trend is be able to break the double top at the level of 1.2350, then the market will continue rising towards the weekly resistance 1 at 1.2430 so as to test the ast bullish wave.

Summary
Urgency
Analytic
Mourad El Keddani
Start trade
Earn on cryptocurrency rate changes with InstaForex
Download MetaTrader 4 and open your first trade
  • Grand Choice
    Contest by
    InstaForex
    InstaForex always strives to help you
    fulfill your biggest dreams.
    JOIN CONTEST

Recommended Stories

Forex forecast 04/11/2025: EUR/USD, GBP/USD AUD/USD, NZD/USD, SP500 and Bitcoin

Useful links: My other articles are available in this section InstaForex course for beginners Popular Analytics Open trading account Important: The begginers in forex trading need to be very careful

Sebastian Seliga 15:20 2025-11-04 UTC+2

EUR/USD Forecast on November 4, 2025

On Monday, the EUR/USD pair continued its decline — one that no longer follows any "rules." Yesterday, we saw that the information background was once again ignored, and now even

Samir Klishi 10:46 2025-11-04 UTC+2

GBP/USD Forecast on November 4, 2025

On the hourly chart, the GBP/USD pair traded horizontally on Monday within the support level of 1.3110–1.3139. Thus, as of Tuesday morning, the price has not yet performed either

Samir Klishi 10:43 2025-11-04 UTC+2

GBP/USD. Technical Analysis on November 4, 2025

Trend Analysis (Fig. 1).On Tuesday, the market from the level of 1.3136 (the close of yesterday's daily candle) may begin moving downward toward the target of 1.3077 — the 176.4%

Stefan Doll 10:27 2025-11-04 UTC+2

EUR/USD. Technical Analysis on November 4, 2025

On Monday, the pair moved within a sideways channel, closing the daily candle at 1.1518. Today, the price may begin an upward movement. On Tuesday, strong calendar news is expected

Stefan Doll 09:10 2025-11-04 UTC+2

With the Golden Cross condition of its EMAs, Natural Gas seems likely to strengthen today. November 04, 2025.

[Natural Gas] – [Tuesday, November 04, 2025] With all technical indicators indicating bullish conditions for Natural Gas, today #NG has the potential to move toward its nearest resistance level

Arief Makmur 06:46 2025-11-04 UTC+2

Crude Oil seems set to strengthen today toward its nearest resistance level.Tuesday, November 04, 2025.

[Crude Oil] – [Tuesday, November 04, 2025] Although the RSI remains in the Neutral-Bearish zone, but with both EMAs intersecting the Golden Cross, it gives an indication that there

Arief Makmur 06:46 2025-11-04 UTC+2

Trading Signals for GOLD (XAU/USD) for November 4-6, 2025: buy above $3,956 (21 SMA - 200 EMA)

The Eagle indicator is showing a positive signal, so we will look for buying opportunities in gold in the coming hours if the price consolidates within the ascending trend channel

Dimitrios Zappas 05:27 2025-11-04 UTC+2

Trading Signals for BITCOIN for November 4-6, 2025: buy above $106,200 (21 SMA - 2/8 Murray)

Bitcoin is trading around $106,574 within a descending trend channel formed on October 27th, bouncing after reaching the key 2/8 Murray support level. If Bitcoin's price consolidates above the 2/8

Dimitrios Zappas 05:25 2025-11-04 UTC+2

Trading Signals for EUR/USD for November 4-6, 2025: buy above 1.1470 (21 SMA - 6/8 Murray)

If EUR/USD consolidates above 1.1470, we could expect a technical rebound, potentially returning the price to the 7/8 Murray price level at 1.1596 and even

Dimitrios Zappas 05:23 2025-11-04 UTC+2
Can't speak right now?
Ask your question in the chat.
Widget callback
 

Dear visitor,

Your IP address shows that you are currently located in the USA. If you are a resident of the United States, you are prohibited from using the services of InstaFintech Group including online trading, online transfers, deposit/withdrawal of funds, etc.

If you think you are seeing this message by mistake and your location is not the US, kindly proceed to the website. Otherwise, you must leave the website in order to comply with government restrictions.

Why does your IP address show your location as the USA?

  • - you are using a VPN provided by a hosting company based in the United States;
  • - your IP does not have proper WHOIS records;
  • - an error occurred in the WHOIS geolocation database.

Please confirm whether you are a US resident or not by clicking the relevant button below. If you choose the wrong option, being a US resident, you will not be able to open an account with InstaForex anyway.

We are sorry for any inconvenience caused by this message.