Dear colleagues!
With inflation raging around the world, the fall in gold prices remains the main mystery. Does gold have a chance to rise?
Indeed, it seems incredible, but despite the rise in prices across the entire range of goods and services, gold is in no hurry to renew its highs, which causes confusion among traders and investors. However, before speculating about the outlook for #Gold's price, let's understand the supply and demand for the precious metal and the factors that affect it in the long and short term.
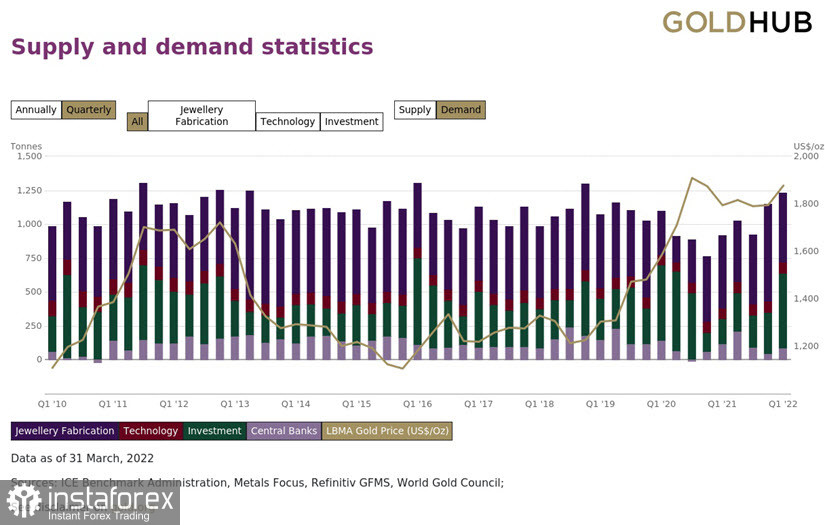
The main consumption drivers are: demand from the jewelry industry, demand from central banks, investment and technology. Moreover, the two main factors of demand are the demand from the jewelry industry and the demand of investors (Fig. 1).
Figure 1: Distribution of demand for gold in the global economy
The largest consumers of jewelry gold are China, India, the US and the EU, while the US and EU countries are the leaders in the investment segment. Like all other commodities, gold is initially denominated in dollars, and only then the price in dollars is converted into other currencies. Thus, we see that the US position in this market is dominant, while the demand from the jewelry industry is stretched over time, and the demand from the investment side, on the contrary, has a short-term, but very significant impact on the price. Separately, it is worth noting the demand from central banks, it is relatively small. At the same time, as a rule, central banks do not buy gold when it is relatively expensive, but replenish their reserves when gold is declining.
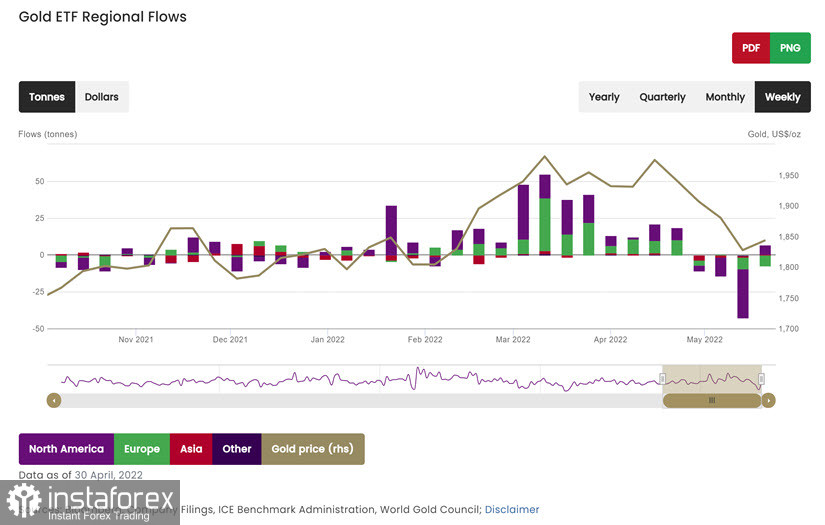
So, in the first quarter of 2022, when gold was actively rising in price, the demand for it was provided by investments primarily in the US and Europe, which made it possible for #Gold to reach the price of $2,080 per troy ounce, after which the market experienced a decline, which was provoked by a decrease in the investment position again in Europe and the USA (Fig. 2).
Figure 2: Regional financial flows to gold exchange-traded funds ETFs
As we can see in Chart 2, according to the data for the week of trading from May 16 to May 20, investors' opinions regarding the prospects for gold have changed, the Europeans were selling gold, and the Americans were buying. At the same time, gold itself was in the range, having formed a "double bottom" reversal pattern on the H4 timeframe, which implies the possibility of a potential price increase on the time horizon of two weeks. I will not post a chart of the "double bottom" model and recommend that readers examine this model on their own in the terminals of InstaForex, where you can find gold under the ticker #Gold.
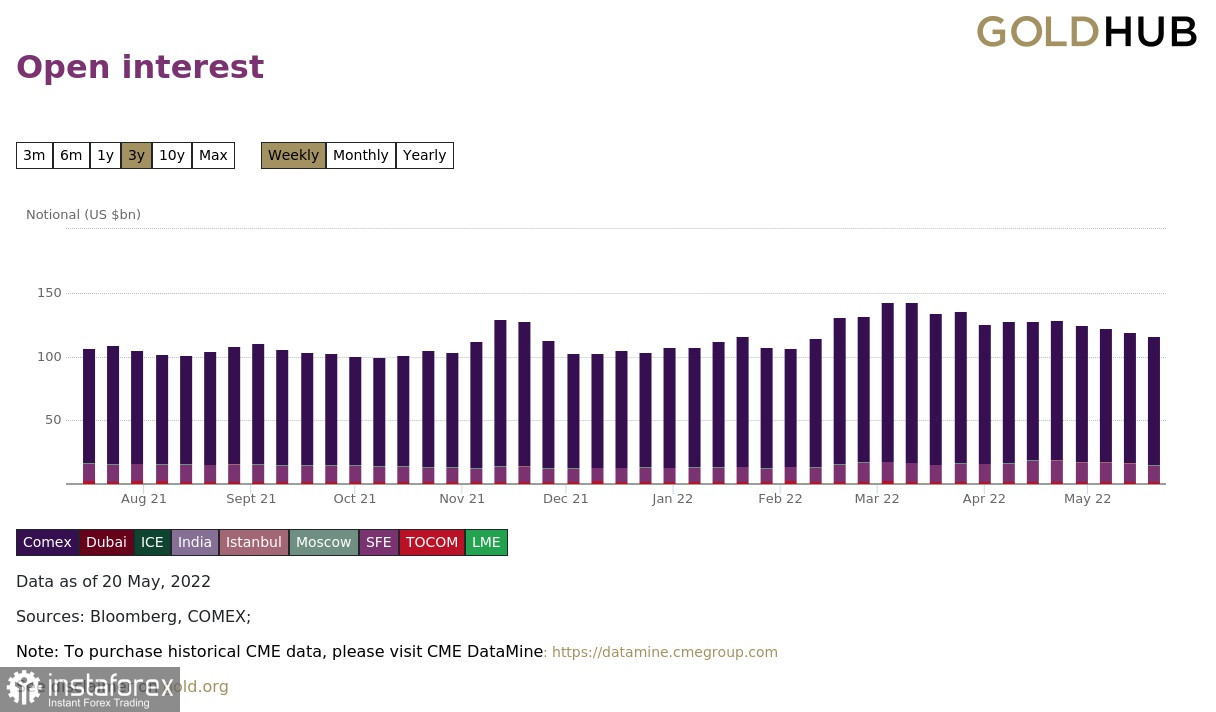
Another important factor influencing the price of gold is positioning, supply and demand in the futures markets, the so-called Open Interest (Fig. 3). As you can see, in the structure of Open Interest, the largest size of open interest belongs to the New York exchange COMEX-CME. Thus, the analysis of open positions on this exchange, available to us through the report on the obligations of traders COT-report, represents a significant opportunity for us to determine the further dynamics of the price of gold. As you can see from the chart, the peaks of OI indicators coincide with the achievement of highs by the price of gold. In turn, the decrease in OR coincides with the decrease in the price of #Gold.
Figure 3: Open Interest in the Gold Futures Market
Analyzing reports on the obligations of traders, it should be taken into account that the positions of the so-called Managed Money, in fact and by definition, are net buyers, most actively affect the growth and decrease in the price. According to the COT-report as of Tuesday, May 17, the positions of this group of traders were declining, as were the OI indicators. However, several days have passed since that moment, and, as we know from the H4 price chart indicators, during this time #Gold formed a "double bottom" reversal pattern, and in the context of this pattern, we can consider the prospects for the growth of the gold price on higher daily time (Fig. 4).
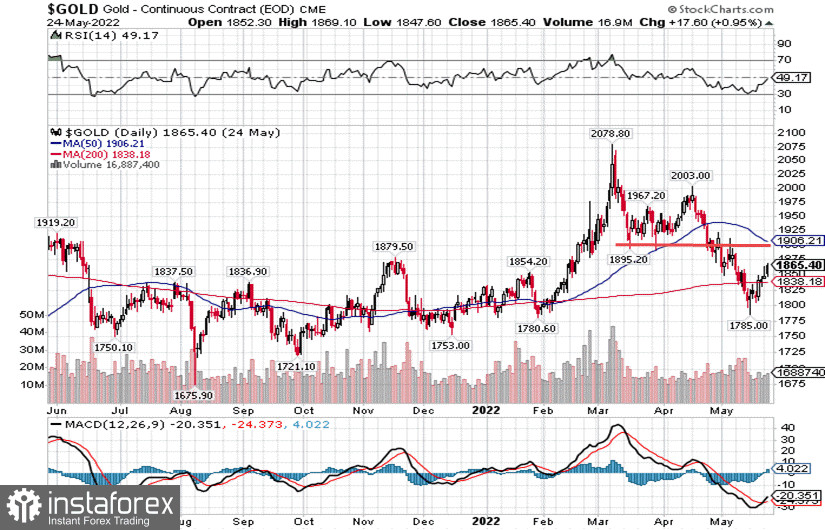
fig.4: #Gold price chart, daily time
Analyzing chart 4, we can state that gold remains in an upward long-term trend, which follows from finding its price above the average annual moving values of 200 MA. However, in a short-term daily trend, with a horizon of one to three months, there was a change in trend direction. This became clear after the current low of 1,785 rewrote the value of the previous low of March 2022 at 1,895, which corresponds to the definition of a change in trend direction.
As a result of this movement, a downward momentum was formed with a length of $228, or from the level of 2003 to 1,785, from which we can draw a very important conclusion that the "double bottom" reversal pattern on H4 should be considered only as the beginning of a corrective growth of #Gold with a target on the level of 1,900. In order to assume further upward movement of the price, gold needs to rewrite the May high located at the value of 1,910. The fact that we have an upward correction also follows from the indicators of the MACD indicator - the value of which is in the negative zone.
So, let's sum up the results of the fundamental and technical analysis of the gold market for May 26, 2022. The price of gold remains in a long-term upward trend, which makes it possible to buy it at current values of about $1,850 per troy ounce with an investment horizon of three to five years or more. At the same time, in the short-term dynamics, the price of #Gold turned into a downward trend with a time horizon of one to three months, to which a corrective recovery is now observed, formed by the "double bottom" pattern on the 4-hour timeframe.
Based on this configuration, traders can consider the possibility of buying gold prices to the level of 1900, in compliance with all requirements and money management rules, and profit and risk ratios of at least 2:1. #Gold as this will be the end of the recovery correction.
If we further simplify the algorithm of the trader's actions, then it will sound like this: if there is a signal from the trading system to buy, buy gold from the zone of 1,850 while aiming for 1,900 and consolidating losses at the level of 1,930. If the price drops and there is a signal from the trading system, we sell #Gold from the price value of 1,930 while aiming for 1,775 and an order to consolidate the loss beyond the level of 1,870.
Key phrase in this algorithm: in the presence of a trading system signal. Be attentive and careful!