Ethereum continues to stay in one place. Bearish prospects remain for the cryptocurrency, but the market is currently in no rush to open new positions. Bitcoin has been trading in yet another flat for about a week, which has caused other cryptocurrencies to remain stagnant as well. There are sufficient "bearish" signals, patterns, and structures across nearly all timeframes to anticipate further declines. There are also some "bullish" warnings, such as a double liquidity grab for buying on the 4-hour timeframe. However, we must remember that any upward movement is merely a correction, and any bullish signal is a signal for correction.
Overall, there is little more to add from a technical perspective regarding Ethereum. The market is turning, but not in a technical sense (the technical reversal already happened a long time ago); it is turning mentally and psychologically. After Bitcoin failed to break its ATHs twice, many realized the upward trend was coming to an end and could not last forever. Even MicroStrategy, which has been heavily investing in Bitcoin in recent years, has paused any new investments in "digital gold." Trading volumes on exchanges are declining, and investors are once again turning their attention to traditional investment instruments. Crypto experts remain divided into two camps. One camp insists on Bitcoin's continued growth (always), while the other believes a bearish trend has begun, with enormous potential for decline. From our perspective, the downtrend for both Ethereum and Bitcoin will continue.
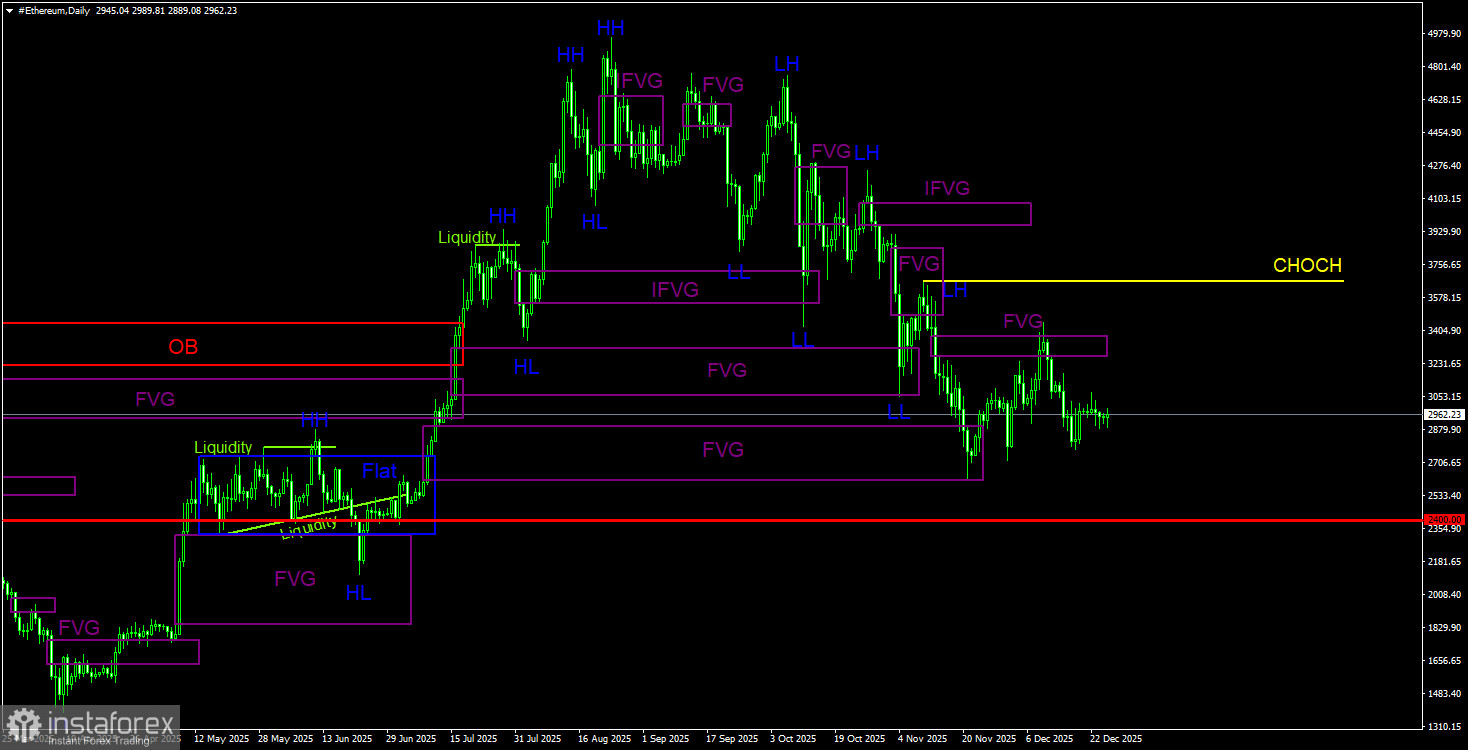
Analysis of ETH/USD on the Daily Timeframe
Ethereum continues to form a downward trend on the daily timeframe. During the crash on "Black Friday," the first of the bullish FVGs was worked out; during "Black Tuesday," the second bullish FVG was addressed; and during the latest decline, the third bullish FVG was activated. The trend structure is currently clear as day and raises no questions. The CHOCH line is at the $3,666 level, which is the last LH (Lower High). As long as the price remains below this level, the downward trend persists. An upward correction may already be over, as Ethereum reached its only unaddressed bearish FVG and received a clear response on the lower timeframe, yet the market is now at a standstill.
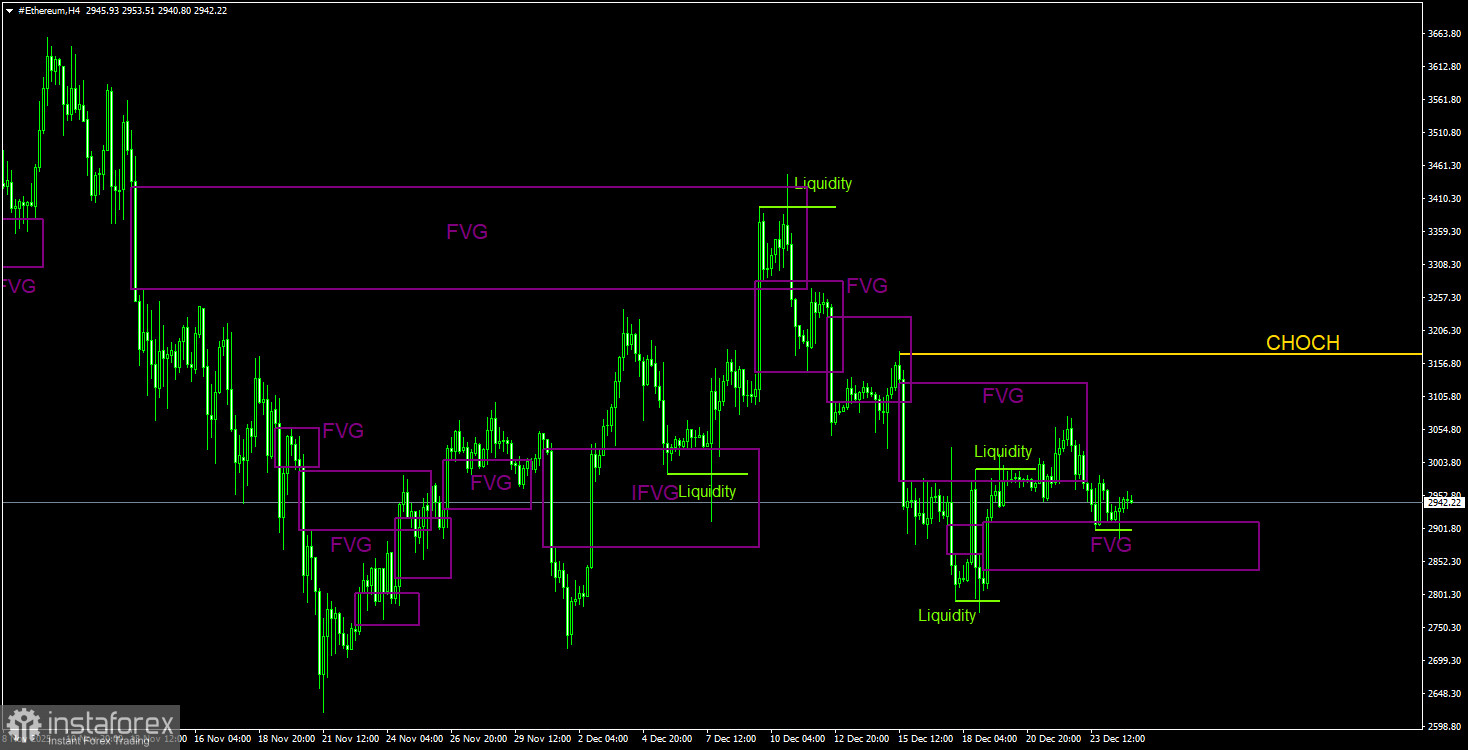
Analysis of ETH/USD on the 4-Hour Timeframe
On the 4-hour timeframe, the upward corrective trend has been broken. The CHOCH line has been surpassed, indicating that the trend for Ethereum is now downward on all timeframes, and primarily bearish signals are being formed. During the last price increase, Ethereum returned to one of its bearish FVGs and got stuck there for several days. Essentially, it can be said that the price responded to this pattern and then dropped to the bullish FVG. The reaction to the bullish FVG could provoke a slight rise, but we must remind ourselves that Ethereum's structure is bearish even on the 4-hour timeframe. Thus, any upward movement is merely a correction. There is also a liquidity grab for buying, which enhances the bullish signal from the FVG.
Trading Recommendations for ETH/USD:
The downward trend continues to form on the daily timeframe. The key selling pattern is the bearish order block on the weekly timeframe. The movement triggered by this signal should be strong and long-lasting. The correction in the cryptocurrency market may be ending. It is not guaranteed that a trend will resume for Bitcoin/Ethereum from the bearish FVG on the daily timeframe, but this area is where it would be reasonable to open short positions. On the 4-hour timeframe, the cryptocurrency may start a new decline, but there are currently no sell signals. The drop targets of $2,717 and $2,618 remain relevant; they are just the nearest targets. The potential for a decline in Ethereum is much greater.
Explanations to Illustrations:
- CHOCH – Break of the trend structure.
- Liquidity – Stop loss of traders that market makers use to build their positions.
- FVG – Fair Value Gap. Price moves through such areas very quickly, indicating a complete absence of one side in the market. Eventually, price tends to return and react to these areas.
- IFVG – Inverted Fair Value Gap. After returning to such an area, the price does not react but breaks through impulsively and then tests it from the other side.
- OB – Order Block. The candle on which the market maker opened a position to grab liquidity for forming their own position in the opposite direction.